

“Taking the text out of context just leaves a con”
This month Phil Nuttridge dives into the data on cholesterol and statins.
Imagine you and I are having a phone conversation. I am driving my car, using the phone on ‘hands-free of course and you are sat at home. During that conversation I tell you that I am driving at 45mph and (perhaps bizarrely but necessary for this analogy) I ask your advice on that. What should your response be?
You don’t need to be a traffic cop to realise the answer depends on rather a lot of so far missing information. If the section of road on which I am currently driving has a 30mph speed limit, then obviously I should slow down. If I am in the outside lane of the motorway, then I should jolly well get my foot down. But only if the section of road in front of me is clear, of course. If I am approaching traffic lights and they are on red, then maybe I should be braking pretty sharply. If I am driving through a section of roadworks with average speed cameras and a speed limit of 50mph, then perhaps my 45mph is just fine.
You see, it is all down to context. Just telling you my speed is pretty meaningless without a whole host of potentially important other data. And without that extra data, any advice related to that speed could be inappropriate.
Hold that thought.
‘BAD’ CHOLESTEROL
Last week a friend contacted me seeking some advice. Recent blood test results showed that her ‘bad’ cholesterol was ‘4.5’ and her total cholesterol was ‘7’. Consequently, her doctor wants her to start taking statins. My friend desperately sought my views.
Let me start by unpacking some of the details. My friend’s ‘bad’ cholesterol, more correctly known as her LDL or low density lipoprotein, is too high and according to what is known as the ‘lipid hypothesis’ this is correlated with poor cardiovascular outcomes [Ref A]. To reduce that risk, the medical paradigm requires that she take statins to reduce her LDL levels and thereby reduce her chances of having a future cardiovascular event such as a heart attack [Ref B].
I have previously written a number of articles about the lipid hypothesis and specifically the history and science of how we arrived at the ‘fat is bad’ [Ref C] and ‘cholesterol is worse’ [Ref D] hypotheses. Neither of those articles delved deep into the role of statins. That was deliberate: Writing articles expressing an opinion of history and/or science is one thing; discussing whether an individual should or should not take a medication is an entirely different matter. I am not a medical doctor. I am not a pharmacist.
There are many books written on statins and cholesterol, many of them written by doctors. I could have taken the easy path and directed my friend to some of those. For example ‘The Great Cholesterol Con’ by GP Malcom Kendrick is where I started over ten years ago [Ref E]. But being both a statistician and nutritionist who avidly reads research output, I feel I can offer some up-to-date insights to the debate of cholesterol and statins, after all Kendrick wrote his book way back in 2007. I am particularly excited to have found a research paper published just a few weeks ago looking at risk factors and heart disease which hugely contributes to this discussion.
As I am not a doctor, I will always duck the direct question of whether my friend, or anyone else should or should not take statins. If I am to assume the role of statistician in this discussion, my ‘job’ is to help my friend better understand the data thereby empowering her to make better informed decisions.
What I hope to show you in this article is that a full discussion of cholesterol and statins is a matter of context. Just as commenting on my driving speed was meaningless without knowing what was going on around me, I hope to show you that knowing just my friend’s LDL score without the context of other related health markers could lead to alternative and potentially more effective health interventions being missed.
So let me take you on a deep dive into some of the data, after all that’s what statisticians love to do. This dive will necessarily involve graphs and numbers. I fully appreciate and accept that I am something of an oddball to get excited by such things, but please trust me that in this particular debate understanding them will be hugely rewarding.
Let me start with data that were contributory to the formation of the lipid hypothesis.
FRAMINGHAM
Research on how diet and lifestyle choices affect health outcomes is very tricky. People and their choices are complex and often there are long time periods between ‘cause’ and ‘effect’.
We can make many different choices regarding what we eat and how we choose to live our lives. We could for example, be vegetarian or we might choose to eat meat. We may drink alcohol – we might drink occasionally or we might drink often. Processed and fast food could be a big part of our diet or else home prepared food could be the entirety of our food intake. We could choose to smoke. We might opt to be a ‘gym bunny’ or prefer to be a couch potato. There are very many choices and variables.
Then, when we are looking at health outcomes, how long do we have to wait? For example, if some of the lifestyle variables I have suggested above are hypothesised to cause cancer, how long do we have to wait to see the effect? Five years, ten years, twenty years? If someone does develop cancer, was it because they smoked, was it because they drank alcohol or was it because they ate processed food? What if they did all three of those things, how do we know which one(s) triggered the cancer? Or was it something else entirely?
A number of long term studies are attempting to address these sorts of questions. I shall be referring to two in this piece: The Framingham Study and the Women’s Health Initiative Randomised Control Dietary Modification Trial (WHIRCDMT). Let me talk about Framingham first.
Framingham is a city in Massachusetts. Since 1948 over five thousand adult residents of Framingham and their descendants have been continually followed with the purpose of correlating their diet and lifestyle to their cardiovascular health. So far over 3,000 scientific papers have been published based on the data from Framingham [Ref F]. It is one of the most referenced epidemiological studies in medicine looking at heart disease.
Framingham has given us a considerable body of data looking at the correlation between key biomarkers and health outcomes. Biomarkers are “….anything that can be used as an indicator of a particular disease state or some other physiological state of an organism” [Ref G]. The level of LDL cholesterol in your blood is one such biomarker, as is your blood pressure, your resting heart rate, your fasting blood glucose and so on. The Framingham data allow us to examine (for example and of relevance to my friend) if people with high LDL levels are more or less likely to have heart attacks. The long duration of this study means we can make some pretty robust assessments of long term correlations and consequences.
Here’s the clever statistics bit. If the study shows that high LDL cholesterol is linked to more heart attacks and also for instance that eating more processed food is linked to increased LDL, we can hypothesise that eating processed food is contributory to heart attacks. If we have data that show statins reduce LDL, then we can also hypothesise that statins will reduce heart attacks. So we have our proxies and measures for the effect of diet, lifestyle and medication on heart disease. [I will caution here that Framingham is an epidemiological study that looks at correlation rather than directly at causation. In another article I will perhaps discuss ‘correlation versus causation’].
So let’s have a look at one particular slice of the data from Framingham. In this slice 5,000 residents were followed for fourteen years. Twice each year during that time their cholesterol scores were measured; in parallel they were monitored for the onset of coronary arterial disease (CAD). Figure 1 shows the graph of the data [Ref H] [Ref Q].
FIGURE 1:
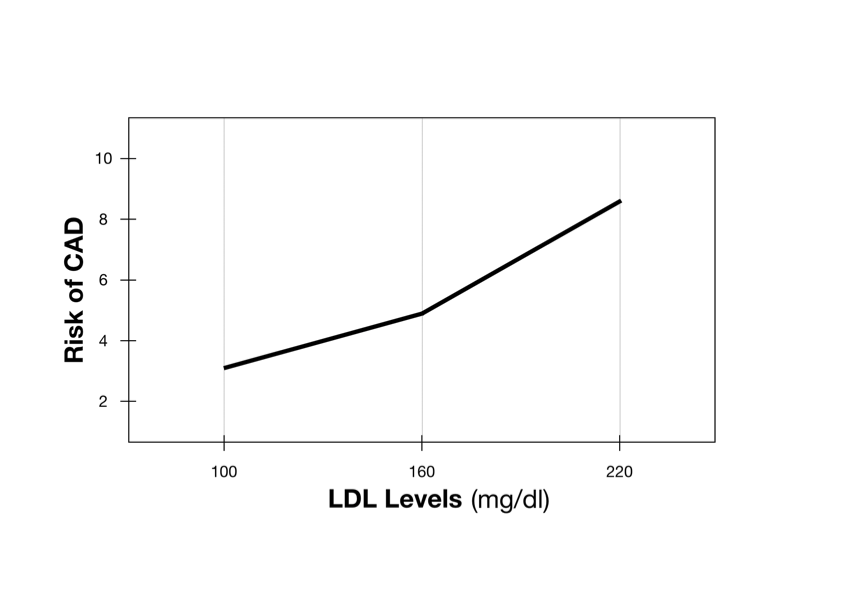
The horizontal axis shows the level of LDL in the blood – the higher the LDL the further right we are on the axis. The vertical axis shows the relative risk of having a coronary artery event (such as a heart attack), the higher up the axis we go the greater the risk.
With this information, the upward sloping line on this graph is fairly easy to interpret: As your levels of LDL increase so your risk of having a heart attack increases. Simple.
From other studies we know that statins will reduce your LDL cholesterol [Ref I]. Combine this with the Framingham data and we can hypothesise that taking statins is an appropriate action to reduce the risk of coronary heart disease.
Perhaps my friend’s doctor is correct: Take your statins, reduce your LDL, reduce your risk. But remember this is all about context.
The cholesterol picture is complex. Whilst we talk about ‘bad’ cholesterol or LDL, there is also something we refer to as ‘good’ cholesterol or more correctly HDL, high density lipoproteins. [I should say here that labelling these lipoproteins as different forms of cholesterol is somewhat misleading – lipoproteins are more analogous to the transport vehicles for fats of various forms, cholesterol just being one of those forms. I shall however keep to the conventional picture of referring to LDL and HDL as ‘bad’ and ‘good’ cholesterol.]
Whereas the graph in Figure 1 looked at the LDL levels for all 5,000 participants, the graph in Figure 2 subdivides the participants into one of four categories according to their level of HDL cholesterol.
With this stratification by HDL, something very interesting emerges from the data. Looking at ‘Line 4’, if your HDL is high then your risk of CAD (heart disease) hardly increases even if your levels of LDL are more than doubled from 100 to 220mg/dl. But if your HDL is low (Lines 1 and 2), then your level of LDL has a greater impact on your CAD risk.
Let me apply my friend’s LDL data to this graph. You may remember her ‘bad’ cholesterol score was ‘4.5’. I need to explain here that there are two different units for measuring LDL and HDL in your blood – ‘mg/dl’ and ‘mmol/l’. You will notice that the Framingham graphs use mg/dl but my friend’s results from her GP are actually using the mmol/l system.
We can however easily convert from one to the other; performing that conversion, my friend’s LDL score of 4.5mmol/l equates to 174mg/dl.
FIGURE 2:
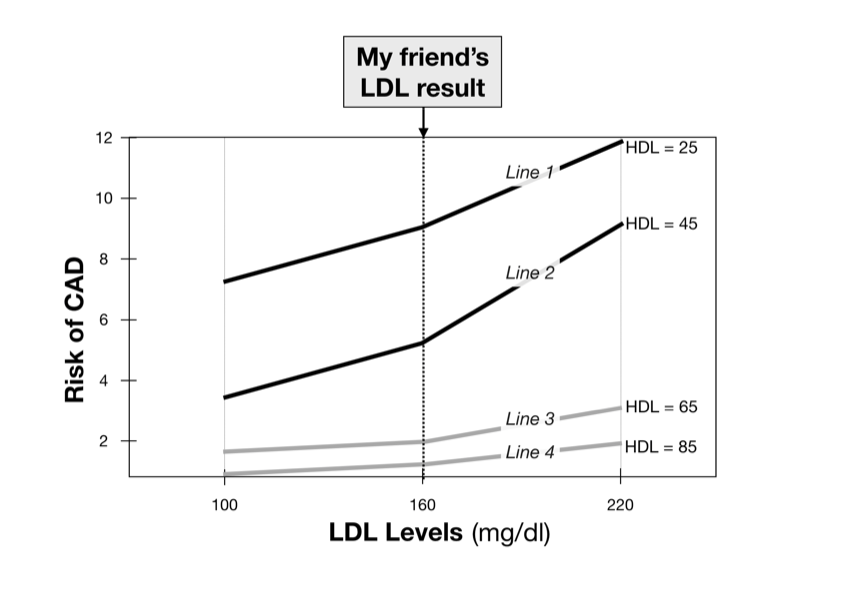
As a LDL level of 174 is not easy to read on Figure 2, I shall round my friend’s LDL result down to 160mg/dl, a point clearly marked on the horizontal axis of that graph. For the following analysis that is sufficiently accurate.
Comparing lines 1-4 at my friend’s level of LDL, you can see her HDL level (if it were known) would make a significant difference to her risk of CAD. If her HDL is high (85mg/dl – Line 4) then her relative risk is around 1.5 and that risk changes little even if her LDL were higher or lower; if her HDL is very low (25mg/dl – Line 1) then her relative risk is nearly 9 and more sensitive to her level of LDL. If she were to take statins to reduce her LDL to (say) 100mg/dl then her relative risk of coronary disease would only change from 1.5 to 1 if she had high HDL (she would be following Line 4) but the benefit would be more if she had much lower HDL (lines 1 and 2). The key thing is that these data show my friend’s benefit from statins would very much depend on her HDL score. Making changes to a low HDL score could have more beneficial impact on health than changing the LDL score.
Can you now see my point about context? Without knowing her HDL score, it makes the benefit of her taking statins difficult to predict. In fact, I would argue these data suggest that if we can only know one of her ‘cholesterol’ scores, then it would be far more informative to know her HDL result than her LDL result. If my friend’s HDL level is low, then we need to help her raise that score. And the way to do that is through following a low carbohydrate/high saturated fat diet [Ref J].
So why is the mainstream medical paradigm so fixated on LDL scores? To my (personal) view it is simply because we have a pharmaceutical model that can lower LDL results (i.e. statins) but only a dietary model to increase HDL results effectively – there is only very limited evidence that drugs can increase effective HDL levels [Ref K]. And in the current medical paradigm pharmaceutical interventions always trump dietary and lifestyle solutions no matter their relative effectiveness. That paradigm is in no small measure the reflection of a population who may find it easier to ‘pop a pill’ than it would be to make enduring dietary and lifestyle changes. But maybe that is an education issue – if people were made aware of how such lifestyle changes can be so much more effective than medication, maybe that could shift the balance.
WOMENS HEALTH INITIATIVE RANDOMISED CONTROL DIETARY MODIFICATION TRIAL (WHIRCDMT)
Framingham is not the only long term study that can shed light on the cholesterol question. The ‘Women’s Health Initiative Randomised Control Dietary Modification Trial’ (WHIRCDMT) was started in 1991 and is constructed to follow a large number of post menopausal women to examine over the long term the role of dietary change on health outcomes [Ref L].
In January of this year (2021) another paper from this trial was published [Ref M]. This recent paper reports on the twenty year outcomes for a cohort of 28,000 of the women involved in the WHIRCDMT. These women had over 50 biomarkers measured at the start and end of the 20 year period and the results of those biomarkers have been correlated to cardiovascular outcomes. The results are the stuff that get statisticians salivating!
The data are very comprehensive and I can imagine very intimidating for the numerically nervous [Ref R – I dare you to look!] To make sense of this ocean of numbers, in the table below I have distilled the results for just seven of the 50 biomarkers that were measured:
I have highlighted four entries in this table (in the ‘under 55’ age group) and by looking at those I hope to help demystify the data (remember all participants in this study are post menopausal women):
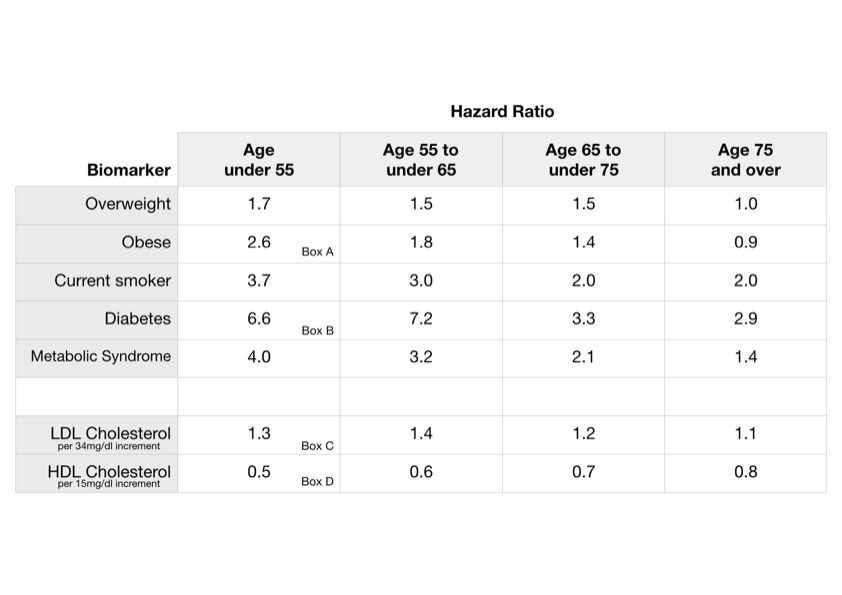
Box A tells us that if you are under 55 years of age and obese then you are 2.6 times more likely to have a coronary heart disease (CHD) event than a peer who is not obese. Said another way, if you are under 55 years old being obese increases your risk of CHD by 260%.
Box B tells us that a similarly aged woman who has diabetes is 6.6 times more likely to have CHD than a peer who does not have diabetes. Or, being diabetic increases risk of CHD by 660%.
Box C tells us that for an under 55 year old woman, for each increase in her LDL level of 34mg/dl, she is 1.3 times more likely to have a CHD event. Expressed as a percentage, every increase in LDL of 34mg/dl increases her chance of CHD by 30%. [34mg/dl is the standard deviation of LDL levels measured in the cohort].
Box D tells us that for the same woman, each 15mg/dl increase in her HDL level halves (or reduces by 50%) her risk of a CHD event. [15mg/dl is the standard deviation of HDL measured in the cohort].
These numbers show us the importance of context. If you are under 55, obese and diabetic and let’s say for good measure, a smoker or diagnosed with metabolic syndrome (a term we use for a clustering of medical conditions linked to insulin resistance [Ref N]), then is your LDL result really going to be of significance? From these data, the answer is pretty clearly ‘no’. The impact that raised LDL has on your CHD hazard ratio is small order (1.3) compared to the impacts of those other listed conditions (2.6 to 6.6). You need to sort those other ‘biomarkers’ of obesity, diabetes and so on, before you worry about LDL and statins.
Okay, so what if none of those listed biomarkers apply to you? What if you’re neither obese, nor diabetic, nor a smoker and have no other signs of metabolic illness? What do these WHIRCDMT data suggest about cholesterol? For each 15mg/dl increase you can make to your HDL score by dietary modification, you will halve your CHD risk. Yet by comparison, each 34mg/dl decrease in your LDL score through taking statins will only improve your CHD risk by 30 percent. Based on these data which would you choose – a change in diet to raise your HDL or statin medication to lower your LDL? With low HDL, the data quite clearly suggest you should make dietary changes first to raise your HDL before considering medication to lower your LDL. To use the statistical jargon, the marginal benefit from raising your HDL with diet is greater than the marginal benefit of lowering LDL through taking statins.
Another biomarker included in the study (but not listed in my above table) is ‘Triglycerides’. In the study data, lowering this score had three times the impact on CHD than lowering LDL cholesterol. The most effective way to lower triglycerides is to follow a low carbohydrate diet – the same diet that raises HDL [Ref J]. So, if your triglycerides are higher than normal, a dietary strategy to reduce these may be more effective than a course of statins because it is a double whammy – it will raise your HDL and lower your triglycerides both of which are correlated with improvements in your cardiovascular health.
I have also not yet considered inflammatory biomarkers. Systemic inflammation and its associated oxidative processes are increasingly being correlated with heart disease. Two common indicators of inflammation are ‘CRP’ and ‘GlycA’ the latter being particularly associated with vascular inflammation [Ref O]. Both inflammatory biomarkers are measured in this WHIRCDMT study and it shows that raised levels of either has a greater impact on CHD risk than raised LDL. Consequently nutritional and lifestyle interventions to reduce inflammation are also worthy of consideration in the discussion of reducing heart disease risk [Ref P].
There are over 50 biomarkers measured in this study and I have focussed on but a few. Many of the 50 have a lesser impact on heart disease risk than LDL cholesterol, but some of the factors have a greater impact. To my view therefore there are fifty pieces of ‘context’ you should consider before immediately jumping to statin medication to reduce just one of them.
BACK TO MY FRIEND
Let me conclude with the advice I would give my friend.
In a sense, my advice could be quite simple – get all the 50 plus biomarkers measured and then let’s look at the whole picture. Of course, no GP is going to have the inclination, patience or resources to assess all of those biomarkers. More pragmatically I would suggest my friend have the conversation with her GP to first make sure (s)he is confident that the more significant factors for heart disease (obesity, diabetes and metabolic syndrome) can be ruled-out. I would also suggest she ask for her HDL, triglyceride levels and inflammatory markers to be assessed as the Framingham and WHIRCDMT data suggest improvements in these can have a greater impact on heart disease risk than alone modifying LDL with statins.
REFERENCES
A: https://www.sciencedirect.com/topics/medicine-and-dentistry/lipid-hypothesis
B: https://www.nhs.uk/conditions/statins/
C: http://www.cuttingcarbs.co.uk/2019/07/03/fatphobia/
D: http://www.cuttingcarbs.co.uk/2020/01/04/a-spoonful-of-sugar-helps-the-medicine-go-down/
E: The Great Cholesterol Con by Dr Malcolm Kendrick. July 2008
F: https://en.wikipedia.org/wiki/Framingham_Heart_Study
G: https://en.wikipedia.org/wiki/Biomarker_(medicine)
H: Gordon T, Castelli WP, Hjortland MC, Kannel WB, Dawber TR. High density lipoprotein as a protective factor against coronary heart disease. The Framingham Study. Am J Med. 1977 May;62(5):707-14. doi: 10.1016/0002-9343(77)90874-9. PMID: 193398.
I: Stroes E. Statins and LDL-cholesterol lowering: an overview. Curr Med Res Opin. 2005;21 Suppl 6:S9-16. doi: 10.1185/030079905X59102. PMID: 16138936.
J: Volek JS, Fernandez ML, Feinman RD, Phinney SD. Dietary carbohydrate restriction induces a unique metabolic state positively affecting atherogenic dyslipidemia, fatty acid partitioning, and metabolic syndrome. Prog Lipid Res 2008; 47: 307-318.
K: Keene D, et al. Effect on cardiovascular risk of high density lipoprotein targeted drug treatments niacin, fibrates, and CETP inhibitors: meta-analysis of randomised controlled trials including 117 411 patients BMJ 2014; 349 :g4379 doi:10.1136/bmj.g4379
L: https://en.wikipedia.org/wiki/Women%27s_Health_Initiative
M: Dugani SB, et al. Association of Lipid, Inflammatory, and Metabolic Biomarkers With Age at Onset for Incident Coronary Heart Disease in Women. JAMA Cardiol. 2021 Jan 20:e207073. doi: 10.1001/jamacardio.2020.7073. Epub ahead of print. PMID: 33471027; PMCID: PMC7818181.
N: https://en.wikipedia.org/wiki/Metabolic_syndrome
O: Connelly MA, Otvos JD, Shalaurova I, Playford MP, Mehta NN. GlycA, a novel biomarker of systemic inflammation and cardiovascular disease risk. J Transl Med. 2017;15(1):219. Published 2017 Oct 27. doi:10.1186/s12967-017-1321-6
P: Barber JL, Kraus WE, Church TS, et al. Effects of regular endurance exercise on GlycA: Combined analysis of 14 exercise interventions. Atherosclerosis. 2018 Oct;277:1-6. DOI: 10.1016/j.atherosclerosis.2018.07.029.
Q: The Carnivore Code. Paul Saladino. Chapter Eleven.